In this video I’m going to walk you through the full Strike Algo record, every year since April 2020. Not just the highlights. The big years, the flat year, and the worst month we’ve ever had.
Here’s why I do it this way. Every trading product on the internet shows you the screenshot that went straight up. Nobody shows you the month that went the other way. If you’re going to put real money behind a strategy, you need to see both, so you know what you’re signing up for.
Everything I’m about to show you is the Strike model record, examined by an independent verification firm. Let’s get into it.
The four numbers that matter
Here are the four numbers I want you to remember.
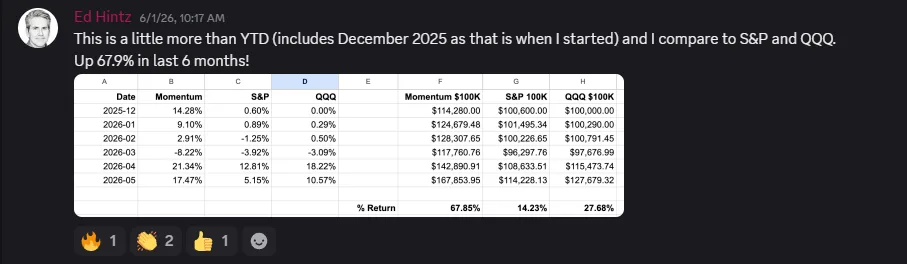
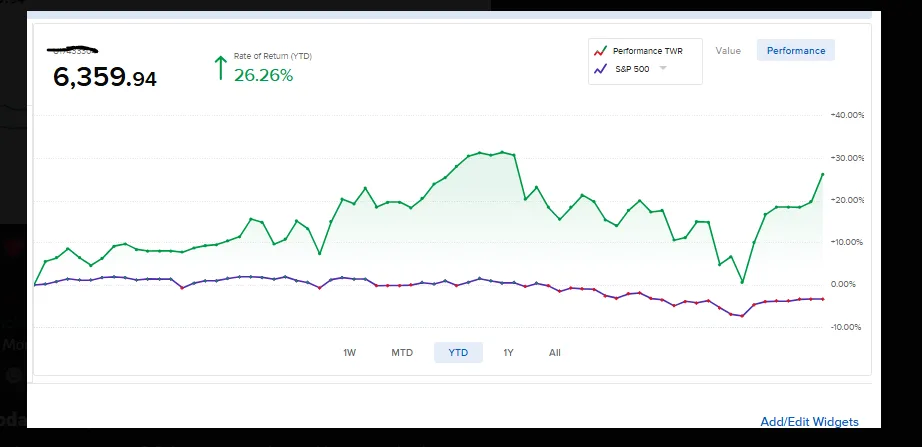
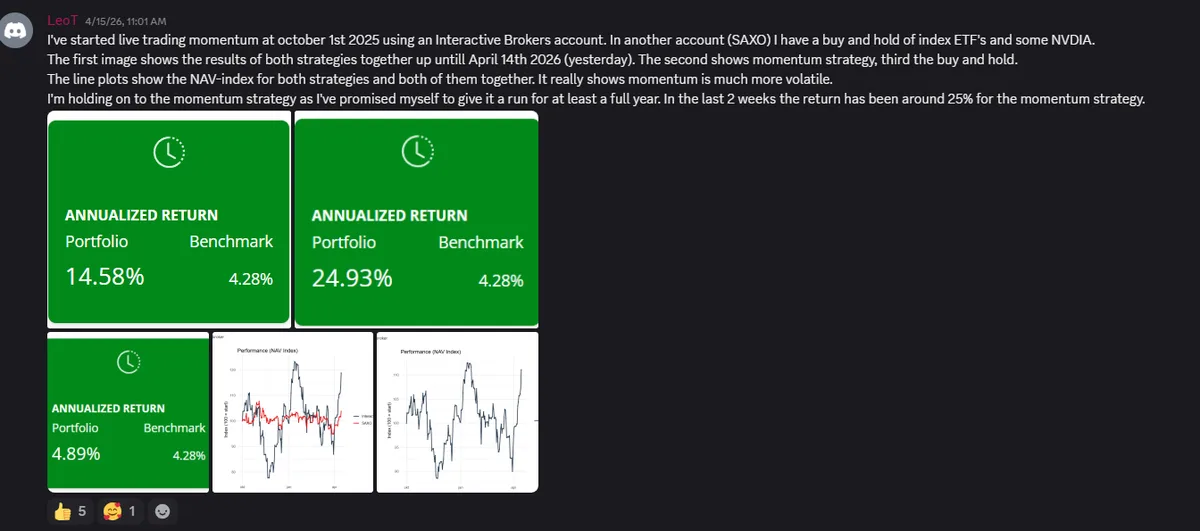
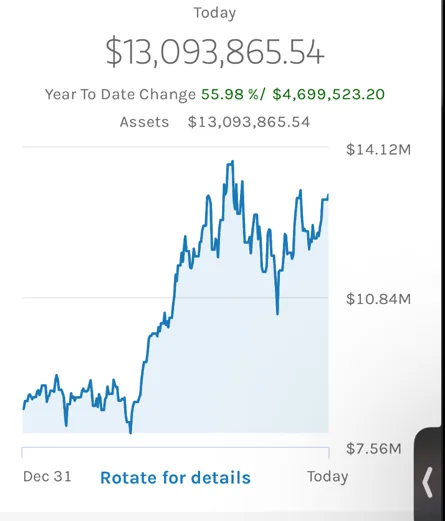
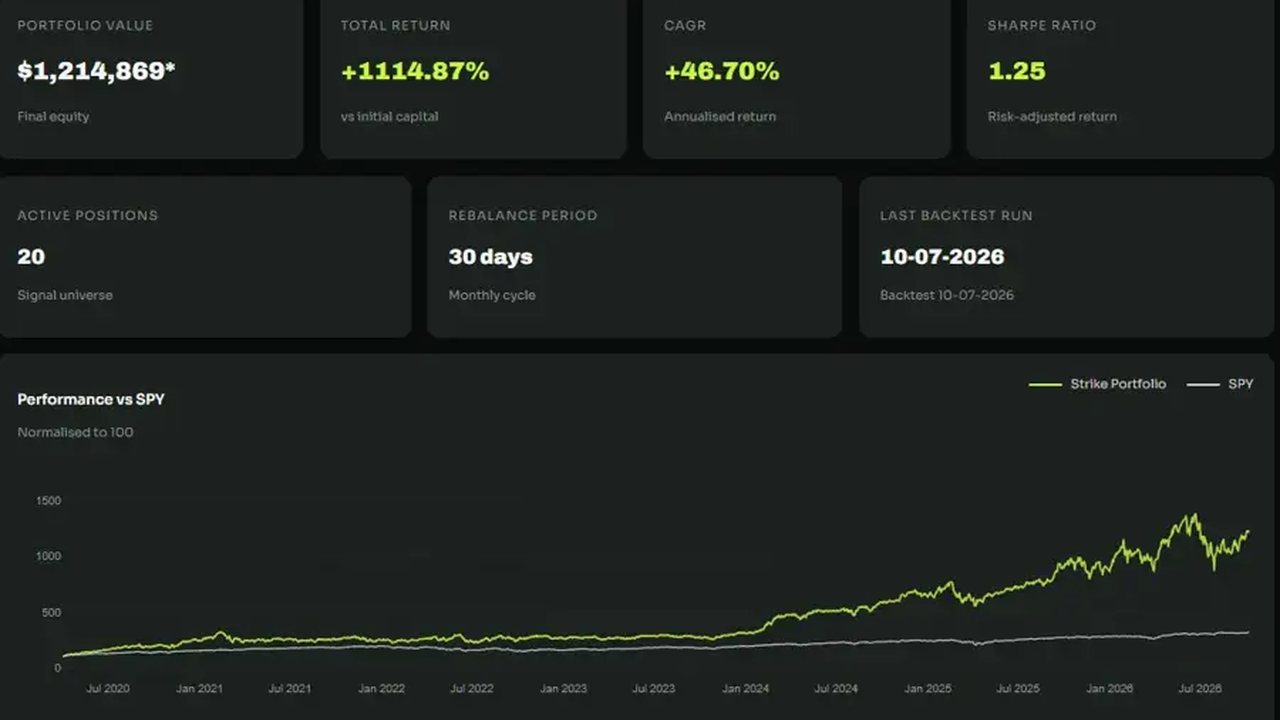
First, the total. From April 2020 to October 2026, the Strike model record is up about 1,094 percent. The S&P 500 over the same period was up about 216 percent.
Second, that works out to about 44.3 percent a year, compounded, against 19.3 percent a year for the S&P.
Now the other two numbers, and these are just as important. The deepest drawdown, from a peak to a low point, was 37 percent. The S&P’s was about 25. And the single worst month was July 2026, down 22.1 percent.
So Strike has done more than the market, and it’s also fallen harder than the market. That’s what concentrated momentum looks like. If a 25 percent drop would make you sell, Strike isn’t for you, and I’d rather you know that now.
Want to walk through the record month by month with a real person?Book a call →Hear it from people who use Strike Momentum pays in bursts
Now let’s go year by year.
2020, starting in April, was a big year: up 139 percent. Then 2021. Strike was up 0.4 percent while the S&P was up 27. That’s a whole year of watching everyone else make money. A lot of people would have quit right there.
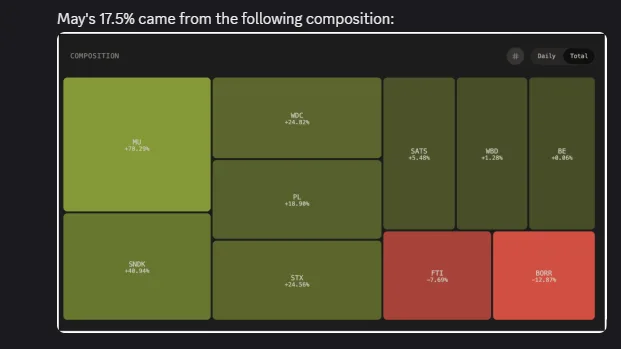
In 2022, the market fell 19 percent and Strike was up 8.6. In 2023 the S&P beat us, 24 percent to about 17. Then 2024 was up 102 percent, as the rankings moved into the AI and chip leaders. 2025 was up about 36. And 2026, through October 9, is up 42.6 percent, even after that rough July.
Here’s the lesson. Momentum pays in bursts. A few years did most of the work. The people who do well with a strategy like this are the ones who stay through the flat stretches, because nobody knows in advance which year will be the big one. And the rules never changed once, the whole time.
See every month. Then talk to a real person.
That’s the full record: the big years, the flat year, the down market where we were up, and the worst month we’ve had.
Every month is on our website, along with the verification report. Go to strikealgo.net and look at it yourself. And if you want to see how Strike would run in your own account, book a call. A real person will walk you through it live.
Why this matters if you’re considering Strike
A record you can trust has bad months in it. Ours does, and we put them up front, because the people who do well with momentum are the ones who knew what they were signing up for. On a call we’ll go through the record with you and talk honestly about whether you could sit through a year like 2021 or a month like July 2026.
What happens on your call1We open the record togetherThe verified report, every month, the good and the bad. Ask anything.
2We map it to your accountHow Strike would run in your own Interactive Brokers account, the minimum, and what the swings could feel like.
3You decidePaper trade first if you like. No pressure, and if it isn’t a fit, we’ll tell you.
$100,000, same months
Jegadeesh & Titman 1993George & Hwang 2004Moskowitz, Ooi & Pedersen 2012
$100,000 invested April 2020, value September 30, 2026. MTUM NAV total returns per BlackRock. Strike: verified model record, gross of fees. Same months.

 Click to watch the video4:26 · Turn your sound on 🔊